Features
Features
Wellbore.AI Features

33 workflows. One end-to-end pipeline.

From raw log import to core calibration, geomechanics, advanced logging, rock physics, unconventionals, coal bed methane, mapping, machine learning and much more — every step of the well data lifecycle runs on a single coordinate framework and a single source of truth.

Request feature demo

Full lifecycle

Every step of the well data lifecycle

The seven modules above are the headline features. Underneath them sit 33 workflows organised into 18 lifecycle groups — from data import to Python API.
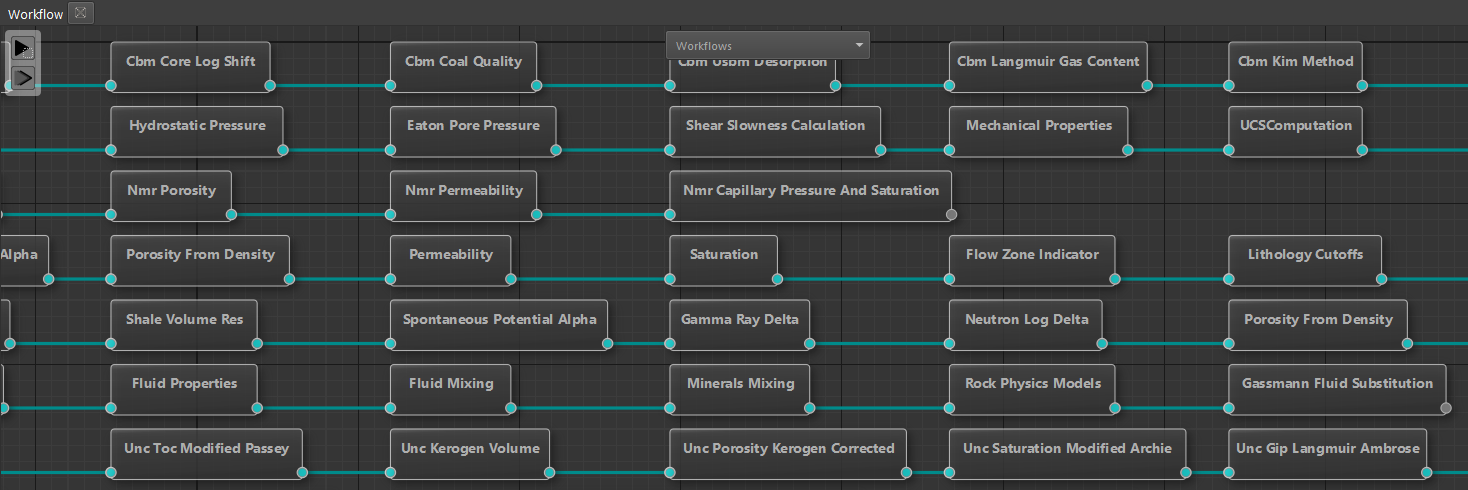
Workflows
1Import & harmonisation Curve families & units, outliers detection — one measurement system for the whole well stock before any formula runs. Learn more
Formats
LAS, DLIS, PDF, XLS and more — all ingested into one corporate database.
Units & families
Automatic curve-family and unit recognition with manual override, so every well speaks the same measurement system.
Outlier detection
Range checks and outlier detection across the entire well stock before any formula runs.
2Curve corrections Preprocessing, environmental corrections with chart-based methods, project-wide data cleaning — turn raw logs into physics-ready curves. Learn more
Environmental corrections
Chart-book methods for the main tool classes, applied consistently across the project.
Preprocessing
Depth matching and splicing of curve intervals to build a clean, continuous record.
Data cleaning
Project-wide cleaning and normalization — turn raw logs into physics-ready curves.
3Automatic QC & correlation Building LQC and project statistics — the system forms the reference log and audits the project without manual curve-by-curve review.
Automatic LQC
Automatic creation of LQC (log quality control) logs across the well stock.
Project statistics
The system builds a consistent reference log and audits the project without manual curve-by-curve review.
Multi-well correlation
Autocorrelation and similarity analysis for fast, repeatable correlation.
Learn more
Conventional petrophysics
4Conventional petrophysics Basic triple-combo interpretation — shale volume, porosity, saturation and permeability from the standard logging suite.
Triple-combo workflows
Full interpretation from the basic logging suite — GR, density, neutron, resistivity, SP and caliper — with chart-book methods and tool support for all major service contractors.
Saturation models
Classic Archie alongside dual-water and other advanced resistivity models, with automatic parameter tuning per zone.
Permeability & cutoffs
Core-calibrated permeability from porosity, FZI and flow-zone analysis; litho- and pay-cutoffs ready for reserves reporting.
Learn more
Volumetric mineralogical model
5Volumetric mineralogical model Joint inversion of porosity, shale and mineral fractions — a continuous volumetric mix of the rock.
Joint inversion
Solves porosity, shale and mineral fractions simultaneously across GR, density, neutron and resistivity.
Continuous composition
Returns a continuous volumetric mix of the rock — the foundation for reserves estimation and flow models.
Field-wide run
Process thousands of wells in a single batch with consistent rules across the whole project.
Learn more
Core routine and SCAL analysis
6Core routine and SCAL analysis Core data management, routine (RCA) and special (SCAL) core analysis, digital core, and log calibration on laboratory measurements.
Core data & routine analysis (RCA)
Import and management of all core study types with photographs; routine core analysis — porosity, permeability, grain density and fluid saturations tied to depth.
Special core analysis (SCAL)
Relative permeability and fractional flow, capillary-pressure processing and saturation-height (SHM) modelling with closure and stress corrections.
Digital core
Digital core workflows and core-to-log calibration on laboratory measurements.
Learn more
Geomechanics
7Geomechanics Full wellbore stability pipeline — stresses, pore pressure and mechanical properties for drilling and stimulation.
Stress & pressure
Vertical stress, hydrostatics, Eaton pore pressure, dynamic and static elastic moduli, UCS, FANG, tensile strength.
Horizontal stresses & gradients
Closure and fracture gradients ready for drilling design, fracking risk and well planning.
Drilling-ready output
Direct input for drilling programs, stimulation design and risk assessment.
Learn more
Rock physics
8Rock physics Elastic modelling and Gassmann fluid substitution — the bridge from petrophysics to seismic.
Elastic properties
Builds velocities, impedance and Vp/Vs under varying saturation, pressure and mineralogy.
Gassmann fluid substitution
Critical for seismic inversion and AVO analysis.
Petrophysics ↔ geophysics
Connects well-scale properties with the seismic scale on the same project.
Learn more
NMR processing and interpretation
9NMR processing & interpretation Total and effective porosity, pore-size distribution, permeability, capillary pressure and saturation from NMR tools.
What NMR gives you
Total and effective porosity, pore-size distribution, permeability, capillary pressure and saturation from NMR tools.
Where it shines
Tight sands and carbonates where standard methods can’t resolve the pore system.
Production-oriented output
Distinguishes bound from free fluid — directly usable for completion design.
Learn more
Borehole image processing
10Borehole image processing Specialised processing of borehole image logs — structural and sedimentological interpretation.
Processing
Standardisation and full processing of image logs from the main tool classes.
Interpretation
Bedding, fractures and structural features picked from image logs.
Learn more
11Acoustics Sonic processing for elastic and mechanical properties.
Processing
Slowness and full-waveform processing for the main acoustic tools.
Output
Elastic properties feeding geomechanics and rock physics.
Learn more
12Cased hole Cement bond log interpretation — bonding quality flags and zone classification for fracking and squeeze work planning.
Cement bond logs
CBL interpretation with bonding-quality flags.
Zone classification
Segment the well into good, partial and poor cement intervals.
Planning output
Direct input for fracking and squeeze-work planning.
Learn more
Unconventionals
13Unconventionals Shales, tight and source rocks — TOC and kerogen, gas-in-place, brittleness and sweet-spot ranking.
TOC & kerogen
Three independent TOC methods (Passey ΔlogR, Schmoker, Modified Passey) with kerogen volume and kerogen-corrected porosity — no more 8–15% overestimation.
Gas in place
Free plus adsorbed gas (Langmuir isotherm, Ambrose correction) with Monte Carlo P10/P50/P90 reserves estimation.
Brittleness & fracability
Elastic moduli, three brittleness methods (Rickman, Jarvie, Wang & Gale) and a composite fracability index for frac design.
Sweet spots
RQ × CQ ranking with industry-standard cutoffs — binary sweet-spot flags for completion planning.
Learn more
Coal bed methane
14Coal bed methane CBM pipelines — coal identification, gas content, cleat permeability, reserves and geomechanics.
Coal & gas content
Coal identification, cavity correction, core-to-log shift, proximate analysis, USBM desorption, Langmuir and Kim methods.
Reservoir state
Gas saturation and critical desorption pressure (CDP); Z-factor and Bg.
Cleats & reserves
Matchstick and Palmer–Mansoori permeability; volumetric GIP, material balance, DCA (Arps) and Monte Carlo GIP.
Geomechanics
Dynamic moduli, Sv, poroelastic Sh and the Rickman brittleness index.
Learn more
15Mud logging Gas chromatography ratios and fluid typing by Pixler & Haworth — real-time hydrocarbon indicators while drilling.
Gas chromatography
Component ratios for in-situ fluid characterisation.
Fluid typing
Pixler and Haworth methods to distinguish oil, gas and condensate shows.
Real-time indicators
Hydrocarbon indicators delivered while drilling.
Learn more
2D geology and correlation
162D geology & correlation Log QC and harmonisation, stratigraphic and automatic well-to-well correlation, and high-performance structural mapping.
Log QC & harmonisation for correlation
Automated QC, unit harmonisation and depth registration of the log suite, so every well is correlated on a consistent, comparable dataset.
Stratigraphic correlation
Manual correlation of markers (horizons) with interactive picking and editing, plus zone-boundary correction.
Automatic well-to-well correlation
Similarity-driven inter-well correlation that propagates markers from reference wells across large well stocks.
Structural & property mapping
Gridding and map construction for structural surfaces and reservoir properties — including isopach maps — ready for geological interpretation.
Performance
High-performance gridding and map rendering — a map over 5,000 wells is generated in under 15 seconds.
Learn more
Machine learning
17Machine learning Clustering, semi-supervised clustering, facies and curve reconstruction — ML built for well data, not borrowed from generic toolkits.
Unsupervised clustering
Automatic electrofacies across the project — fast first-pass lithotypes from log curves.
Semi-supervised clustering
Anchor on core-defined facies and let the algorithm propagate them to the rest of the field.
Facies reconstruction
Train a facies model on described wells and predict it across the whole field.
Curve reconstruction
Recover missing or rejected log intervals from neighbouring wells and a trained model.
Learn more
18Python & API User scripts plug your own Python nodes into the pipeline; the API opens the platform to corporate pipelines and automation.
Jupyter inside the platform
A fully integrated Jupyter Notebook with direct access to project data.
Bring your own IDE
Work from VSCode and other IDEs, using any Python library.
Open API
Expose data and algorithms to corporate pipelines — GeoDB, T-Navigator and Petrel integrations.
Learn more

See the pipeline on your own data

Drop us a few wells and we’ll run the full chain — from import through petrophysics, core calibration and geomechanics — so you can judge the workflows against your field, not a demo dataset.

Request demo    Platform overview